| HK$Mil | 2024 | 2023 | 2022 | 2021 | 2020 |
|---|---|---|---|---|---|
| OPERATION | |||||
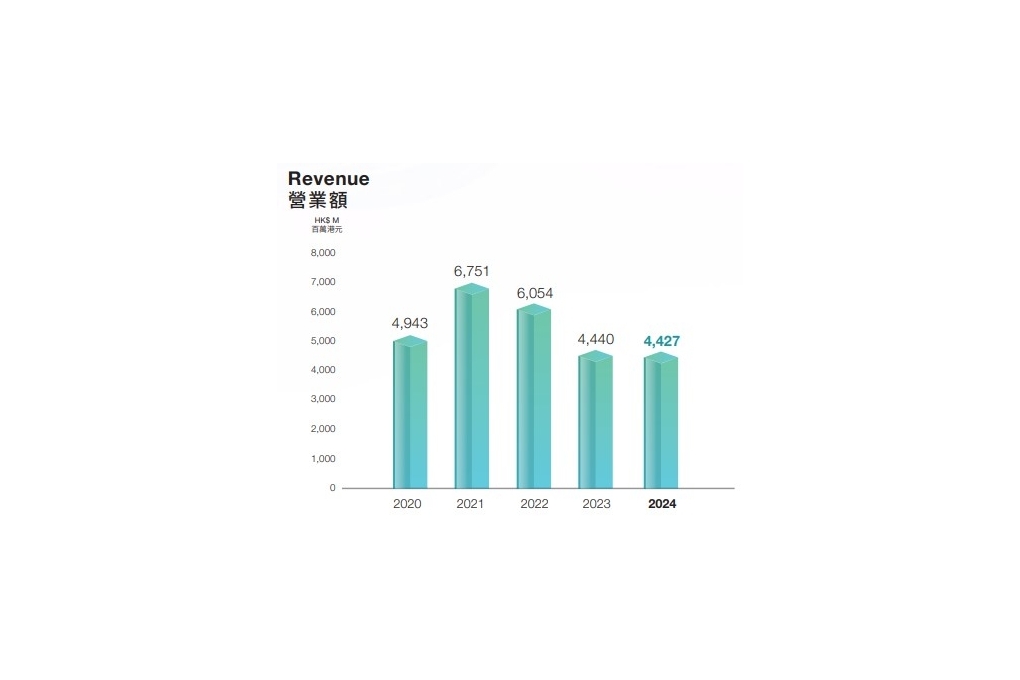
| Revenue | 4,426.6 | 4,440.2 | 6,053.6 | 6,751.2 | 4,943.2 |
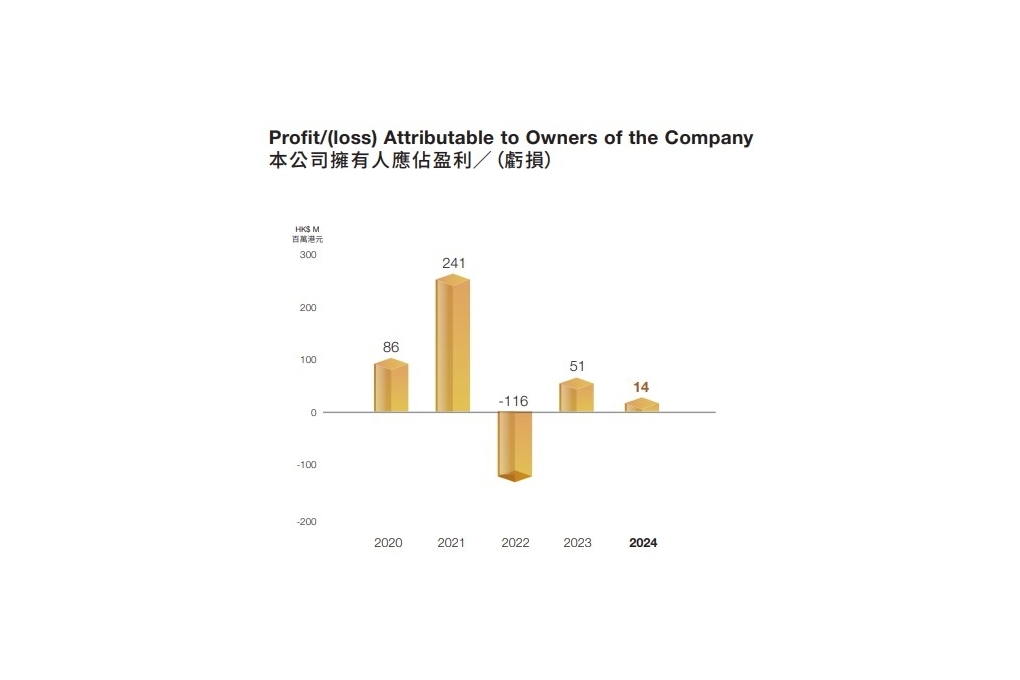
| Profit for the year attributable to owners of the Company | 14.3 | 50.9 | (115.5) | 241.3 | 85.7 |
| FINANCIAL DATA | |||||
| Depreciation and amortisation | 175.2 | 180.2 | 206.2 | 211.5 | 190.7 |
| Finance costs | 13.1 | 26.3 | 21.4 | 15.2 | 19.6 |
| Net current assets | 2,123.3 | 2,203.5 | 2,193.0 | 2,248.8 | 2,059.3 |
| Long term bank borrowings | - | 91.1 | 235.5 | N/A | 7.1 |
| Equity attributable to owners of the Company | 3,237.6 | 3,268.3 | 3,221.1 | 3,560.2 | 3,394.6 |
| Total assets | 4,614.6 | 4,900.8 | 5,046.8 | 5,748.4 | 5,425.7 |
| COMMON STOCK DATA | |||||
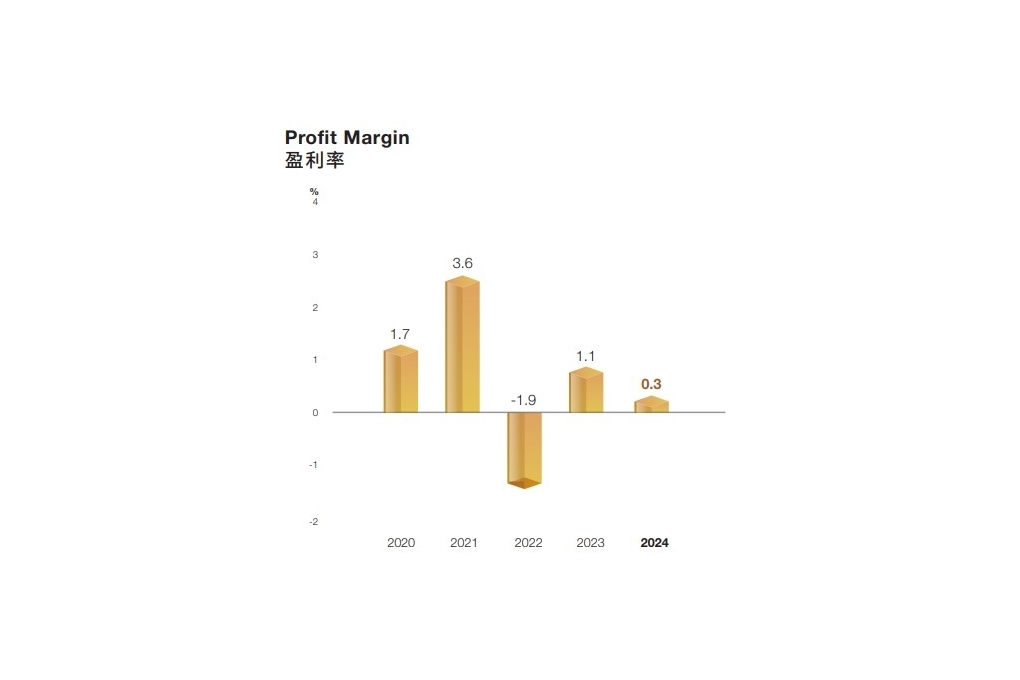
| Basic earnings per share (Hong Kong Cents) | 1.2 | 4.2 | (9.4) | 19.7 | 7.0 |
| Final Dividend per share (Hong Kong Cents) | 1.16 | 3.0 | 0 | 16.0 | 7.0 |
| Special Dividend per share (Hong Kong Cents) | 4.34 | N/A | N/A | N/A | 0 |
| Share price(HK$ per share) | |||||
| High | N/A | N/A | N/A | N/A | NA |
| Low | N/A | N/A | N/A | N/A | NA |
| FINANCIAL STATISTICS | |||||
| Current ratio | 3.2 | 2.9 | 2.9 | 2.3 | 2.3 |
| Net debt/EBITDA ratio | (4.6) | (3.6) | (5.1) | (1.0) | (3.2) |
| OTHER DATA | |||||
| Share in issue ('000 shares) | 1,225,027 | 1,225,027 | 1,225,027 | 1,225,027 | 1,225,027 |
| No. of employees (person) | 5,500 | 5,800 | 5,900 | 7,900 | 7,600 |

Investor Relations
Financial Highlights